This week I noticed Datacamp had a half price special, only$200 AUD for a years subscription. So I have cut down on playing games (sorry Battlefield V) and used that time to learn the tidyverse on datacamp.
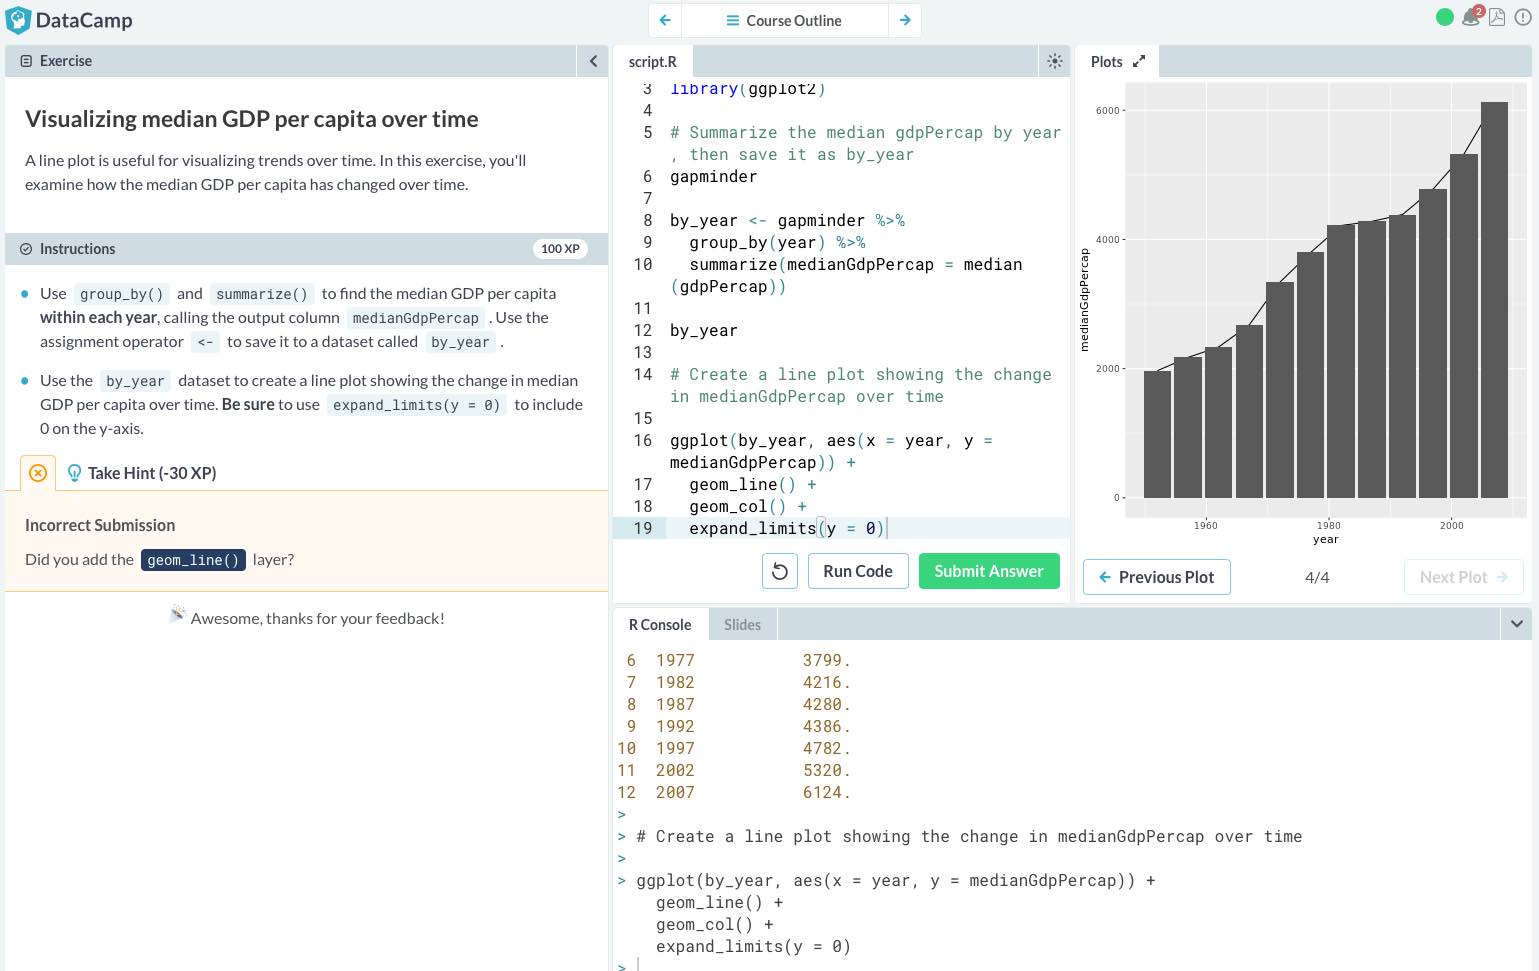
According to Datacamp’s website it is “the smartest way to learn Data Science Online. The skills people and businesses need to succeed are changing. No matter where you are in your career or what field you work in, you will need to understand the language of data. With DataCamp, you learn data science today and apply it tomorrow.“